Job market paper
Is waiting enough?
HODL is the claim that you do not have to time anything: buy, sit still, and let long enough do the work. I believed it with my own money. This is what happened when I finally tried to check it.
HODL Strategy or Fantasy? 480 Million Crypto Market Simulations and the Macro-Sentiment Effect
Where it starts
How it started
I started buying cryptocurrency around 2020. I bought, I mined, I held. The belief was simple, and it was mine: hold long enough and it works out.
A few years later, most of what I had put in was gone. My first instinct was not to leave. It was to buy more, further down, and wait longer.
That was the first time I stopped and asked the question properly. What evidence did I actually have that waiting longer would make it better? I could name plenty of people it had worked for. I could not name what it had cost the people it did not work for.
That question is this paper.
The belief did not stay in 2020.
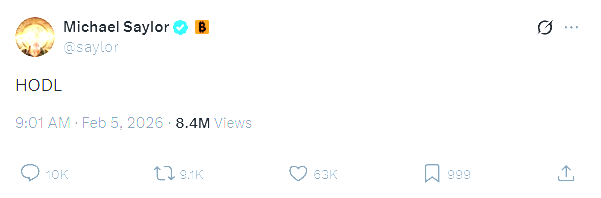
One word, posted in February 2026 and seen 8.4 million times. Years after the cycle that made HODL famous, people are still buying on the same promise I did. That is the reason to test it carefully instead of waving it off.
The question
Better off than what?
Open any feed and someone is explaining that your money is dying. Not slowly. The dollars in your account are being printed away while you sleep, and the only question left is what you move them into.
Then comes the chart. The Nasdaq beside Bitcoin, same axis, no argument attached. You decide, they say, and they say it generously. Here are two futures. Pick one.
If you feel late, there is a line ready for that too. You missed Bitcoin when it cost less than a coffee, and nobody gets that twice. But this token, the one you have not heard of, is where Bitcoin was in 2013, and this time you are early.
- Bitcoin13.31×
- Nasdaq Composite3.95×
- One month Treasury bill1.25×
- What a dollar buys0.74×
Every year, as numbers
| Month | Bitcoin | Nasdaq Composite | One month Treasury bill | What a dollar buys |
|---|---|---|---|---|
| Dec 2017 | 290.3 | 107.4 | 100.3 | 98.9 |
| Dec 2018 | 78.4 | 103.2 | 102.2 | 97.0 |
| Dec 2019 | 152.3 | 139.6 | 104.3 | 94.8 |
| Dec 2020 | 612.2 | 200.5 | 104.7 | 93.6 |
| Dec 2021 | 978.2 | 243.4 | 104.7 | 87.3 |
| Dec 2022 | 350.1 | 162.8 | 106.4 | 82.0 |
| Dec 2023 | 894.9 | 233.5 | 111.6 | 79.4 |
| Dec 2024 | 1980.5 | 300.4 | 117.3 | 77.2 |
| Dec 2025 | 1855.0 | 361.5 | 122.1 | 75.2 |
| Jul 2026 | 1331.0 | 394.7 | 124.6 | 73.7 |
I am not going to pretend this does not work. It worked on me.
So take the pitch at its word. It always ends in the same two words, better off, and never finishes the sentence. Better off than what? Over these same 9 years the safest thing those dollars could have done paid about 2.5% a year. That is the whole bar. Put the same dollars against it on the same days, charge the fees you would really have paid going in and coming out, and see what is left of the lead.
So zero means you matched cash: the Treasury bill, rolled over your own days. Below zero means the waiting left you behind it.
The two things a success story already knows
Every story about holding is told by someone who knew two things you did not: which coin, and which day.
Say you object. You would have waited for a dip. Maybe you would. But that is a timing rule, and the claim on trial here is the one that says you need none. A fair test of that claim cannot quietly hand the investor a good coin on a good day.
So the paper hands both of those choices to chance. One episode is one complete investment, start to finish:
Draw a coin
One token, drawn at random from the 378 in the broad basket. An episode buys that one coin, not a portfolio of all 378.
Draw a day
A buy date picked uniformly from the days that token could actually have been bought and held that long. Nobody gets to see whether it was cheap.
Draw a length
How long to hold, drawn at random inside a band. The six bands run from a day to a month at the short end up to two to three years at the long, and each one is answered on its own.
Settle up
Sell, pay both fees, and subtract what a rolling Treasury bill earned over the identical days. What is left is that episode’s answer.
Every basket and every holding band gets 10 million episodes, 480 million in all. The answer lives in the tails, and tails are what small samples get wrong.
Three of those baskets run side by side on this page: a coin drawn from the 378, Bitcoin every time, and Ether every time.
What came back
Both of these came out of the same experiment.
Hold for two to three years. Here is the middle result, and the best quarter, for each of the three baskets.
Two to three years of holding
Best quarter, on average
- what the story skips+1,326.7
- +2,002.8
- +1,664.4
Middle outcome
- −28.4behind cashAny of 378
- +296.9Bitcoin
- +164.3Ether
The coin decides the typical result. Draw at random and the middle hold finished behind cash. Pick Bitcoin instead and it finished far ahead. The best quarter is big in all three columns. Those gains are real. They are just not what the middle got.
So how often did the waiting actually go wrong?
The same episodes, counted a different way. Pick a holding length and all three baskets answer at once.
Out of 100 holds lasting two to three years, this many finished more than 10 percentage points behind cash.
55.2%
Any of 378
9.1%
Bitcoin
25.2%
Ether
731–1095 days · each square is about one hold in a hundred
All six holding lengths, as numbers
| Days held | Any of 378 | Bitcoin | Ether |
|---|---|---|---|
| 1–30 | 29.9% | 14.9% | 21.9% |
| 31–90 | 46.5% | 26.9% | 36.4% |
| 91–180 | 50.9% | 28.6% | 39.3% |
| 181–365 | 53.4% | 23.1% | 34.6% |
| 366–730 | 53.6% | 18.8% | 36.7% |
| 731–1095 | 55.2% | 9.1% | 25.2% |
The three baskets do not age the same way. In the broad basket the shortfall climbs at every step, and the longest holds are the worst of all. Bitcoin and Ether get worse first, then thin out at the far end. The six lengths are six separate experiments, not one investment getting older.
What you would do now
Bitcoin’s record is real. What does it tell you about buying today?
Take those numbers at face value. Over two to three years, the middle Bitcoin hold beat cash by 296.9 points, and its best quarter averaged 2,002.8. Now the version of the question that costs money: you buy today and hold just as long. Which instinct is yours?
Two ways to read that record
You are reading the market by its own performance.
That is how most people forecast, and it is not naive: an asset that has been paying holders is telling you something about itself. It is also a claim with a testable edge. Does a basket’s own recent run line up with what it goes on to pay?
You are reading the market by what everyone already believes.
That is closer to how an asset pricer thinks: prices move when expectations do, so a run everyone has already watched may be spent. Testable too. Is the mood at the moment you buy more informative than the record?
Both instincts point at something you can already see on the day you buy: what the market has just done, and the mood it did it in. The paper measures each one against what actually followed.
The recent record is the part that does not travel.
How a basket had just been doing turns out to be a poor guide to what it went on to pay. It matters in a few individual coins and not in the rest, and pooled across baskets the relationship is close to nothing.
What travels is the mood, and it points the other way.
Sustained optimism on the day you buy goes with lower returns afterwards.
What sustained optimism means here
Not your mood but the market’s, and not one loud afternoon but months of it: a 24-week moving average of the Crypto Fear & Greed Index, taken on the day you buy.
6–12 mo
1–2 yr
2–3 yr
- Bitcoin
- Ether
- Dogecoin
- Not credible at 95%
HODL sets its best trap exactly when it looks least like one.